Air Quality Assessment Report for an Industrial Vacant Warehouse
Raphael da Costa · SensusAir BioDefense Platforms · Study period 11–17 February 2025
Published 09 Oct 2025 · 10 min read
Abstract
A seven-day evaluation of indoor air conditions at an industrial vacant warehouse using three AirVue sensors, measuring particulate matter, carbon dioxide, volatile organic compounds and nitrogen oxides. PM2.5 approached regulatory limits, VOCs fluctuated moderately, CO₂ was stable with one exceedance event, and NOx was persistently elevated. The report recommends filtration upgrades and ventilation enhancements before reoccupation.
Key findings
- PM2.5 weekly average
- 11.5 µg/m³
- Fine fraction share
- ~75%
- CO₂ exceedance
- 1,088 ppm
- NOx peak
- 465 index
Exceeds the WHO annual guideline of 5 µg/m³
PM 0–1 µm and 1–2.5 µm as a share of PM2.5 mass
Single event on 11 February, classified poor
17 February spike, classified very high
Introduction
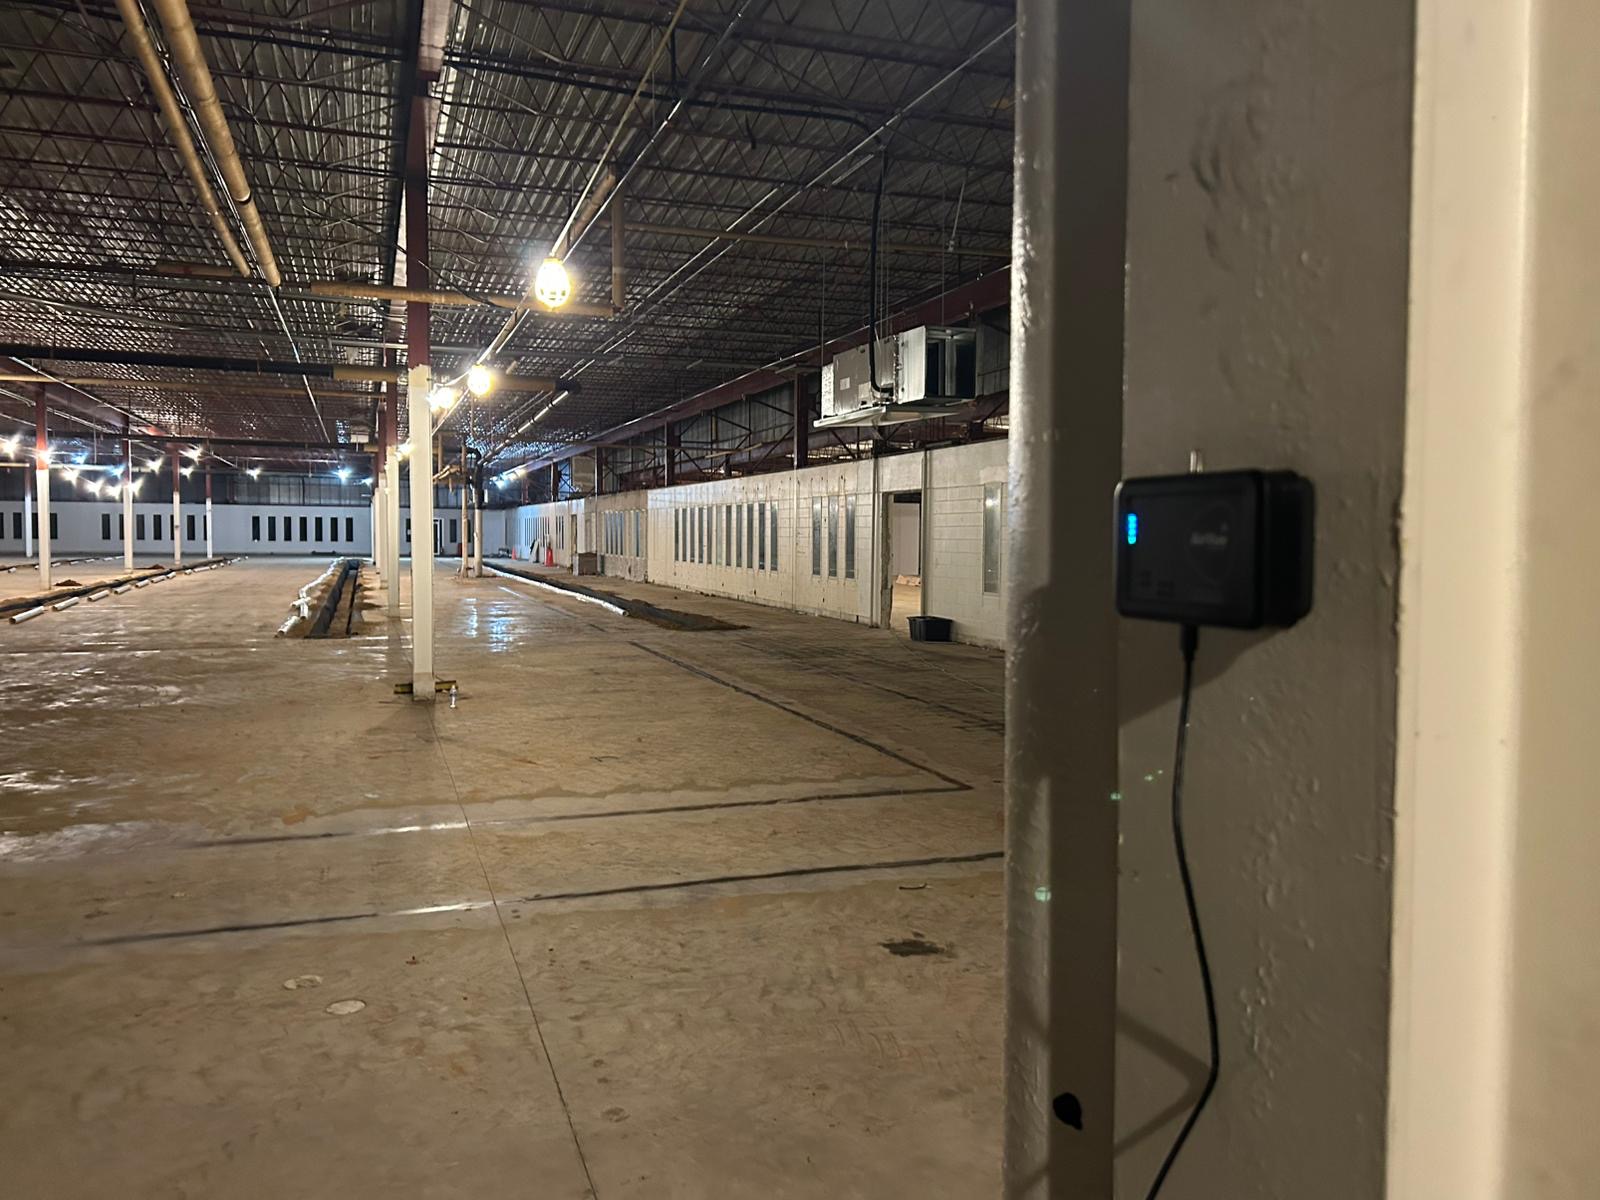
The facility was formerly used for manufacturing and presents a deteriorated, open structure, potentially allowing dust and pollutant infiltration. Assessment objectives focused on regulatory compliance, health risk identification, and actionable improvements for occupant safety.
Three AirVue sensors were deployed for seven days to establish whether the building could be reoccupied without remediation.
Background and regulatory context
- EPA NAAQS PM2.5. 35 µg/m³ (24-hour average), 12 µg/m³ (annual average)
- WHO guidelines PM2.5. 15 µg/m³ (24-hour), 5 µg/m³ (annual)
- CO₂ benchmarks, good below 800 ppm, acceptable 800–1,000 ppm, poor above 1,000 ppm
- NOx index, low 0–50, moderate 50–100, high 100–200, very high above 200
- VOC index, low 0–50, moderate 50–200, high 200–400, very high above 500
Methodology
The AirVue monitoring system captured PM mass and number concentrations, CO₂ levels, NOx and VOC indices, atmospheric pressure, altitude, temperature and relative humidity.
Particulate matter was resolved into size bins. PM 0–1 µm, PM 1–2.5 µm, PM 2.5–4 µm and PM 4–10 µm, which is what makes the fine-fraction finding below possible. Sensors were calibrated per manufacturer specifications and data were validated for consistency.
Results: particulate matter
- Daily PM2.5 range. 9.5 to 15.0 µg/m³
- Weekly average PM2.5. 11.5 µg/m³, exceeding the WHO annual guideline of 5 µg/m³
- PM10 range. 14.5 to 20.0 µg/m³
- Peak event, 11 February, maximum PM2.5 of 20.97 µg/m³ and maximum PM10 of 27.72 µg/m³
- Fine particles (PM 0–1 µm and PM 1–2.5 µm) composed approximately 75% of PM2.5 mass
Results: carbon dioxide
Daily averages ranged from 700 to 750 ppm, within the good range below 800 ppm. A single exceedance on 11 February reached 1,088 ppm, classified as poor. Levels stabilised after that date.
Results: nitrogen oxides
Daily average NOx index ranged from 135 to 464 and sat frequently within the high band of 100–200 or above it. A spike on 17 February reached an index of 465, classified very high, and coincided with elevated particulate levels, a combination consistent with a combustion source rather than general infiltration.
Results: volatile organic compounds
Daily averages ranged from 102 to 209, classified moderate. A peak on 11 February reached 310, entering the high band of 200–400. The lowest day was 17 February with an average of 111 and a maximum of 154. Potential sources include benzene, toluene, formaldehyde and related compounds associated with prior manufacturing use.
Health risk assessment
Fine particles pose significant health risks including respiratory conditions such as asthma and bronchitis, cardiovascular events including heart attack and stroke, and premature mortality, the WHO attributes 4.2 million deaths annually to PM2.5 exposure.
CO₂ above 1,000 ppm can cause discomfort and reduced cognitive performance, though the single exceedance here was brief. High NOx causes respiratory irritation, and VOCs at elevated concentrations produce irritation and headaches with long-term carcinogenic risk.
Conclusions
The assessment confirms generally good to moderate air quality with notable concerns. PM2.5 levels approach regulatory thresholds and are driven by the fine fraction. CO₂ was mostly good with a brief poor exceedance. NOx was frequently high with a very high spike. VOCs were moderate with a high exceedance. Health risks from fine particles and NOx require immediate attention.
Recommendations
- Install HEPA filtration to reduce PM2.5
- Enhance ventilation to prevent CO₂ and NOx buildup
- Investigate NOx sources behind the 17 February spike
- Improve dust control to minimise PM infiltration through the open structure
- Investigate VOC sources behind the 11 February spike
- Maintain regular sensor calibration
- Continue monitoring with periodic assessments
References
- 1.US EPA. National Ambient Air Quality Standards (NAAQS) for particulate matter
- 2.WHO. Global air quality guidelines (2021)
- 3.ASHRAE. Ventilation and indoor air quality guidance
Take this further
Download the original document, or see how the same measurement approach applies to your estate.
Reproduced from the original publication page.